![[Univ of Cambridge]](Graphs_files/uniban-s.gif)

![[Dept of Engineering]](Graphs_files/engban-s.gif)
The ebar package (a local version of the bar package) is ok for simpler graphs. See The LATEX Companion for more details.
\begin{center}
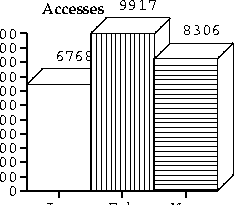
\textbf{CUED Gopher Usage, 1994}

\begin{figure}[htbp]
\begin{barenv}
% set the 'z' axis depth
\setdepth{10}
%Scale the height
\setstretch{.01}
% Put the numbers above the bars. Other options include 'empty',
\setnumberpos{up}
% Set type of x labels (numbers by default) but could also be 'days'
\setxvaluetyp{month}
% Set the x origin, end, and step size
\setxaxis{1}{3}{1}\setxname{Activity}
% Set the y origin, end, and step size
\setyaxis{0}{10000}{1000}\setyname{Accesses}
\ebar{6768}{1}
\ebar{9917}{2}
\ebar{8306}{3}
\end{barenv}
\end{figure}
\end{center}
