|
|
 |
Portfolio |
 |
-Markowitz
Portfolio
|
 |
 |
Harry Markowitz presented
a theory for selecting financial securities for an investment
portfolio in the paper "Portfolio Selection",
in the Journal of Finance, Vol. VII, No. 1, March
1952. The paper is widely referenced. Two generally conflicting
measures evaluate the portfolio, the expected return and
the variance of the return. The latter represents the
risk of the portfolio. The investor desires a
portfolio that has a high return and low risk. Since the
goals of maximizing return and minimizing risk are usually
conflicting, we create a model that minimizes variance
while satisfying a constraint on the return. By solving
the model for a series of returns we obtain an efficient
frontier of solutions. Depending on the investor's
risk tolerance, he or she should choose one of these solutions
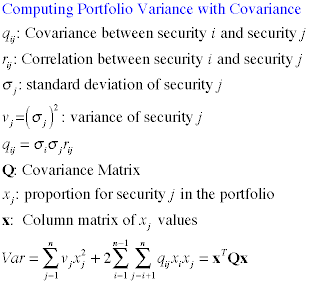
Markowitz computes the variance of a portfolio using the
Covariance matrix.
|
The Portfolio add-in creates the structure to hold
historical data, constructs a mathematical programming model,
provides for solving the model and provides for generating the
efficient frontier.
The Math Programming add-in constructs the math programming
model and the Solver add-in solves the model, so those
two add-ins must be installed in addition to the Portfolio
add-in. Before attempting to create a model, choose the Solver
command from the Tools menu. This opens the Solver
dialog. Then immediately close the dialog. This establishes
contact with the Solver. This step must be
performed every time Excel is launched.
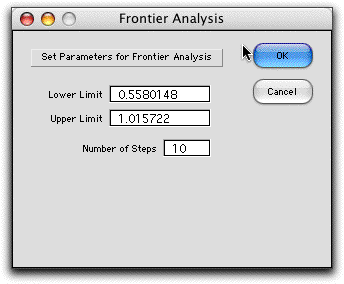
To create a model choose Markowitz from the Portfolio
menu. The dialog below is presented to set the size parameters
for the problem. We choose an example with eight securities
with 24 periods of data. The model will minimize variance subject
to a constraint on return. Alternatively, we could maximize
return subject to a constraint on variance. The Frontier analysis
is only available with the minimize variance option. When selected
the Make Random Problem option provides data that is
randomly generated, but realistic.
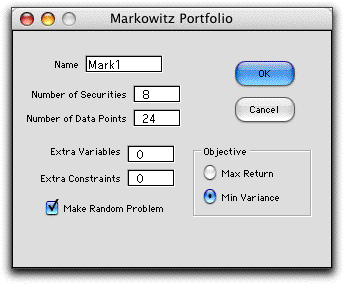
The Extra Variables and Extra Constraints
boxes allow the creation of a larger math programming model
for more complex problems.
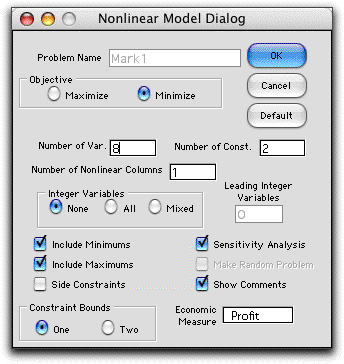
The next dialog that appears is from the Math
Programming add-in. It specifies the creation of a nonlinear
programming model. Some of the information on the dialog may
not seem correct but the add-in changes the model after it is
placed on the worksheet. Although it is possible for the user
to change some of the items on this dialog, it best to accept
all the data as presented.
|
Worksheet |
| |
The add-in creates a new worksheet
with the name specified in the Portfolio dialog. Since there
is quite a bit of information on the sheet, we describe the
sheet from the bottom up.
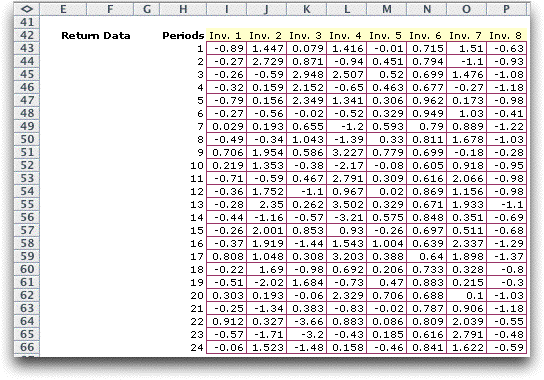
The first information presented are the rows for data. A randomly
generated example is shown with 24 periods of data. The interval
of the period depends on the frequency of portfolio changes
envisioned and the availability of data. For a long-term investor,
a one month period would seem reasonable. The data describes
the returns for the periods measured as percentages. The first
item, –0.89, would indicate a decline of 0.89% in the
value of the associated security.
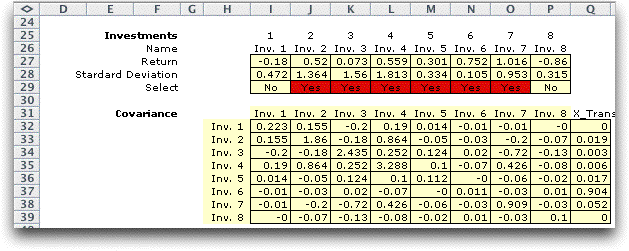
Immediately above the data is the statistical
analysis necessary for the Markowitz model. Row 26 holds the
security names. These can be set by the analyst and they will
be reflected throughout the worksheet. Row 27 computes the average
value for each data column and row 28 computes the standard
deviation. Row 30 indicates with a red field the securities
that have nonzero values in the portfolio. The matrix in the
range I32:P39 is the covariance matrix. The main diagonal holds
the variances of the securities.
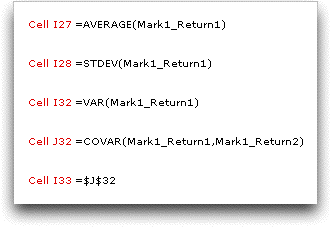
The statistical analysis is entirely computed
with Excel built-in functions. Some representative cell formulas
are shown below. The name in the formulas (Mark1_Return1) refers
to data cells in the range I43:I66. Cells on the main diagonal
are computed with the VAR function. Cells above the
diagonal are computed with the COVAR function and cells
below the diagonal equal the corresponding values above the
diagonal.
The covariance matrix is always symmetric and
has the positive definite characteristic. This guarantees
that the variance objective is strictly convex and that there
is a single local minimum point that is also the global minimum.
This simplifies the problem of finding the optimum solution.
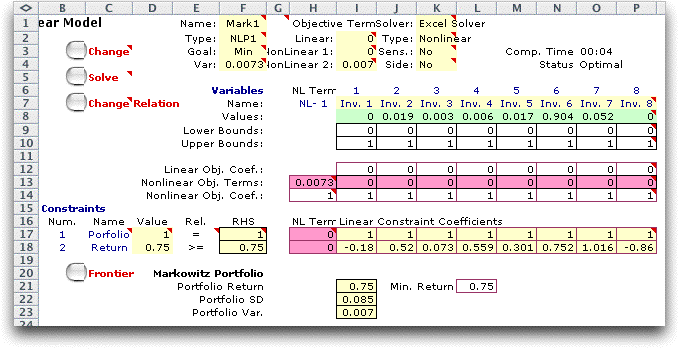
The math programming model is at the top of the
worksheet. A mathematical statement is given later on this page.
The result shown below is the minimum variance solution when
the return is required to be at least 0.75. This value is entered
in cell L21. All yellow areas in the model hold formulas and
should not be changed by the user. Cell H13 computes the variance
of the portfolio using matrix computations. Row 17 holds the
constraint that the portfolio proportions must sum to 1. Row
18 holds the constraint that the average return be at least
0.75. |
|
This is a nonlinear
minimization problem with a convex objective function and linear
constraints. With these conditions there should be a unique
local minimum (if there is a feasible solution). The Excel Solver
will sometimes report that there is no feasible solution when
there actually is one. We have found that setting the initial
proportions to 1/n in the green array of Row 8 often
leads to a feasible solution.
As suggested by Markowitz, the optimum solution will often
be diversified with several securities included in the portfolio.
This is also suggested by the nonlinear-strictly convex nature
of the objective function. For the example, investment 6 with
the greatest return comprises 90% of the portfolio with five
other securities completing the portfolio. We will see that
the character of the solution changes with the value chosen
for the minimum return. |
Efficient Frontier |
|
Clicking the Frontier
button on the worksheet initiates the process of finding the
efficient frontier. The add-in sets the lower bound on the return
to zero and solves the model. The result is the minimum variance
solution. The corresponding value of the portfolio is used as
the lower limit on the frontier. The upper limit on the return
value is the largest return from the available securities. If
this security is selected as the sole component of the portfolio
the highest portfolio return is obtained. This return is used
as the upper limit. Both limits may be changed if the analyst
would like to investigate a narrower range. The number of steps
in the analysis is provided by the entry in the third field.
The range of returns is divided into the specified
number of intervals and the model is solved for the interval
boundaries. There will be one more solution than the number
of steps. The results are shown in the table below for the example.
Only feasible solutions are included in the table.
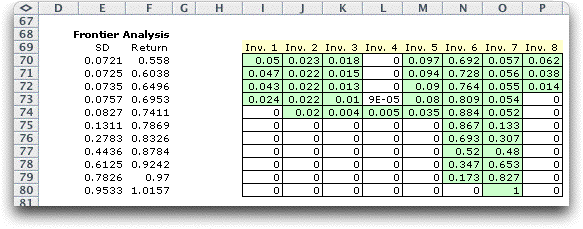
The minimum variance solution (as indicated by
the standard deviation column) uses seven securities and has
the maximum diversity. As the minimum return is increased, the
resultant solutions have increased variance and are generally
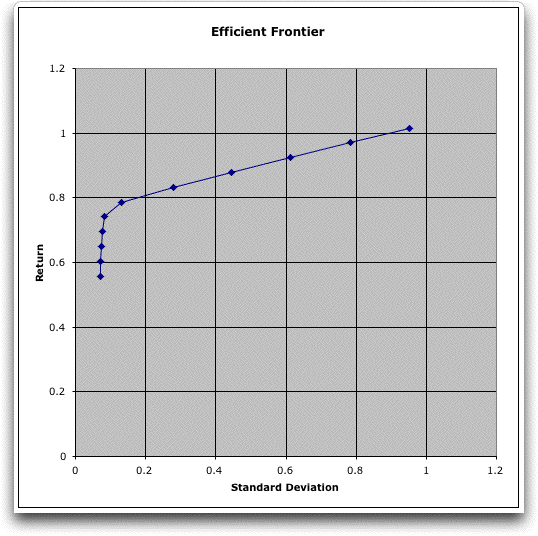
less diverse. The final solution uses only security 7. The chart
of the frontier, placed below the table on the worksheet, shows
that the portfolio return initially sharply increases as the
variance is increased only slightly. After about 0.7, higher
returns can only be obtained with significantly increased variability. |
| |
The efficient frontier
for the Markowitz portfolio consists of a continuum of solutions
and the frontier will be a strictly concave function. We only
find a finite number of solutions and connect adjacent solutions
by straight lines on the chart. The actual frontier will have
solutions slightly above the lines. A more accurate frontier
can be found by using more steps in the analysis. |
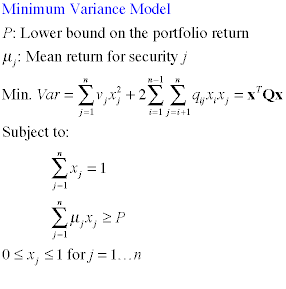
Math Programming Model
|
|
The variance of the portfolio can
be computed from the Covariance matrix as shown below.
We use statistical estimates from the historical data to compute
the Covariance matrix used by the model.
The math programming model limits the total return while requiring
that the security proportions sum to 1. The goal is to minimize
portfolio variance.
The model may also be constructed to maximize return with a
constraint on the variance. Since this model has a linear objective
function with a nonlinear constraint, the problem is somewhat
more difficult to solve than the minimum variance model.
|
CREF Example
|
|
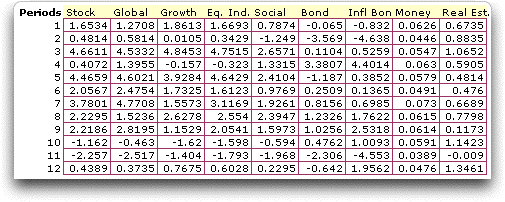
To illustrate data taken from reality, we obtained the monthly
unit values for the asset funds of the CREF annuity investment
account. The data for one year is shown below.
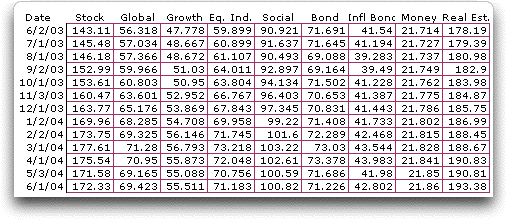
We compute the monthly return for each fund with
the formula:
100*(BV - EV)/BV
BV is the unit value at the beginning of the month,
EV is the value at the end of the month. We multiply by 100
to express the returns as percentages. The resultant table of
returns is below.
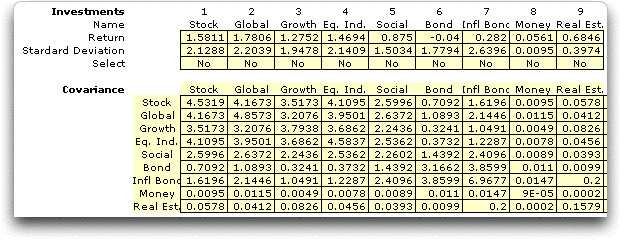
Statistical analysis computes the following averages,
standard deviations and covariance matrix. Note that all the
covariances are positive in this case.
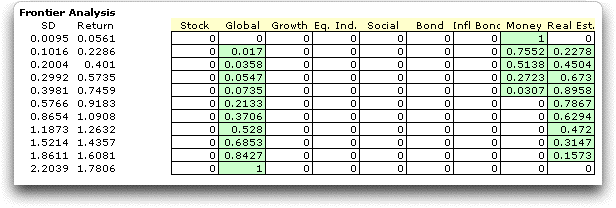
Solutions on the efficient frontier with ten steps
are found using the add-in.
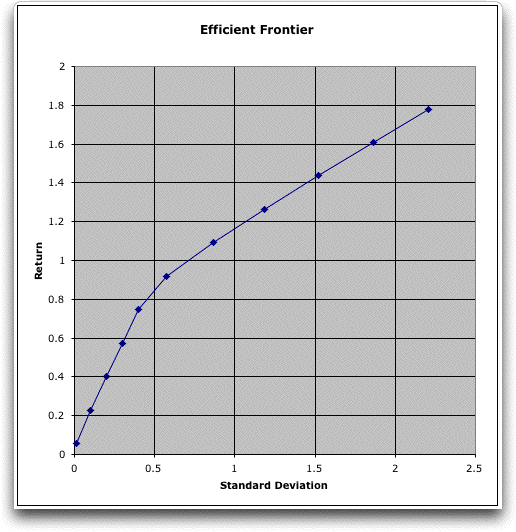
The corresponding efficient frontier is in the
graph below.
The minimum variance portfolio uses only the Money
Market investment. The maximum return (with maximum variance)
invests in only the Global Equities. Intermediate solutions
use a combination of Money Market, Real Estate and Global Equities.
The portfolio for a specific investor depends on his or her
risk preference. Our example uses only one year of data. The
results would probably change if a longer history were used. |

|