 |
|
The Hurricane program tracks and forecasts hurricanes in and
around the Gulf of Mexico. It accepts data published by the National
Hurricane Center (NHC). The tracking program is implemented
using VBA modules in an Excel workbook,
hurricane.xls. The workbook also contains the data
for Hurricane Allen that is used in this section to illustrate
the use of the program. To download the workbook, click on
the Workbook link at the left. Clicking the link
labeled Historic
Hurricanes will download a workbook with the data and
descriptions of 36 important hurricanes that have been observed
since 1900.
Note that the modules are in a workbook (.xls) rather than
an add-in (.xla). Open hurricane.xls by double clicking
or through the Open command of the file menu. Data
should be kept in the same workbook as the macros. A single
file can store several storms. The file can also be duplicated
to store multiple storms.
The Hurricane workbook contains buttons created on the author's
computer. Before you can use these buttons, you must link them
to the macros in your computer. You can do that by selecting
the Reset
Buttons menu
item. The program replaces buttons with new buttons linked
to the programs in your computer. |
| |
The original forecast
models were developed in the late 1970s by Bill Lesso, Professor
Emeritus of the University of Texas. They were based on using
a Markov process to model the movement of a storm, i.e. the
next position only depends on the current position. To develop
the probability transition matrices, several hundred historic
storms tracks dating back to 1886 were used. The result was
a simple, fast computer model that could be run on the newly
introduced PC’s. On contract the NHC was using several
different models that could be described as ‘aerosol
physics’ models consisting of several hundred partial
differential equations that, at that time took several hours
to run.
The first Lesso models
were fast but inconsistent. The models gave either very good
forecasts or forecasts so bad that one colleague stated that
one were better off spitting upwind! To improve the consistency,
a two-step Markov process was introduced and later, the probability
transition matrices were changed to be latitude and longitude
dependent. Finally, Tom Curry did an extensive analysis of
the
storms as part of his PhD dissertation research, "Time
Series Prediction of Hurricane Landfall", May, 1986, and
added a new variation. The current model uses the current position
of the storm; the position six hours back and the position of
the storm one-day (24 hours) back. Also, he replaced the probability
transition matrices with a set of regression equations that
are specific for each five-degree band of latitude. The result
is a model that is consistent and gives good accurate forecasts.
As with all forecasts, the results rarely indicate the exact
path of a hurricane. Any use of this program is not the responsibility
of the authors. Don’t bet your life or your property
on them! |
Adding a Hurricane |
| |
The examples of this
section as well as all the macros and other resources necessary
are contained in the Hurricane Workbook. To use the
workbook, simply open it as any Excel workbook by double clicking
its icon or using the Open command on the Files
menu. Depending on the security measures set on your copy of
Excel, the program may ask if you want to enable the macros
in the program. If you want to use the features of the workbook,
you must answer yes.
If you are opening a workbook containing hurricane worksheets
created on another computer, you may have trouble using the
buttons on a worksheet. If so, select the Reset Buttons
menu item. The program replaces buttons with new buttons linked
to the programs in your computer. |
| |
|
To illustrate the use of the workbook,
we use the hurricane Allen, a large hurricane that
occurred in 1980. To create a new hurricane, select New
from the Hurricane menu. |
| |
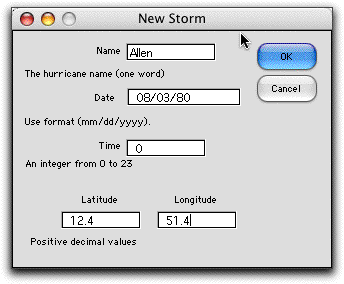
A dialog is presented
as below. The name entered on the dialog is used as
the name of a worksheet and to provide Excel names for a number
of ranges on the worksheet. Once selected the name cannot be
changed. The dialog provides boxes for the initial date, time,
latitude and longitude. Although longitudes in the Gulf area
are negative, for simplicity they will be entered as positive
numbers. The latitudes accepted by the program are between 10
and 45 degrees. The longitudes accepted are between 50 and 100
degrees.
|
| |
The worksheet named
Allen is created in the workbook, and a form is placed
on this worksheet with space for 50 observations of the hurricane
location. The initial data specified in the dialog is placed
in the first row. The Observation entry in cell B2
is the current entry. As subsequent observations are entered,
the macro changes this number. The Map designated in
cell D2 is used to plot forecasts.

Initially, the NHC issued storm position reports
at six-hour intervals. This model is based on the six-hour interval
and the forecasts are made on this basis. Later, the NHC began
issuing position reports at 3 and even 2-hour intervals as the
storm approached landfall. To accommodate a change in interval,
we suggest that a second forecasting series be started, with
a new name, say ‘Allen-B’, and the two models be
used alternately to model the storm. (To get the second series
started, you may want to develop ‘fictitious’ first
4 points by interpolating between points of the first series.) |
Adding Observations |
| |
To the right of the
form are three buttons. The first is used to enter a new observation,
the second is to create a forecast and the third to perform
an error analysis. We discuss adding observations first.
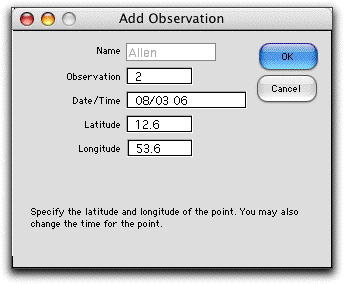
Clicking the New Observation button presents the dialog
below. The observation number is one greater than the current
observations. The time is automatically entered. Note that times
are specified by the day and hour. The day is given as in 08/03.
After a space, the time is given as in 06. The purpose of this
dialog is to enter the new latitude and longitude. You can also
change the observation and time if your purpose is to correct
an earlier error.
The new information is placed on the worksheet.
The number in the Move column is the number of nautical
miles between the first and second observations. This value
is computed by a function that takes into account the latitudes
and longitudes of the two observations. The Speed column
shows the speed required to move this distance in the six hour
interval. The cells in these columns are colored yellow to indicate
that the cells contain formulas that should not be changed by
the user.

The data in this table can be changed directly
on the worksheet. If additional observations are manually entered,
the observation number in B2 must be manually adjusted. |
| |
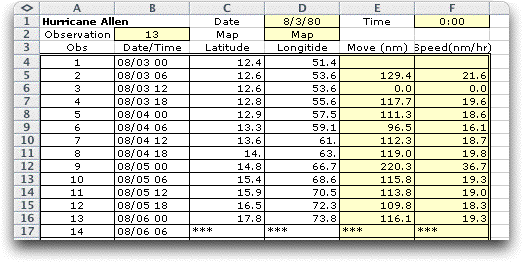
After 13 observations
the data form appears as below. The observations on the table
are the positions actually observed in 1980.
|
Making a Forecast |
| |
With at least 5 observations,
a forecast can be made. To make a forecast click on the Forecast
button. There is also a Forecast item on the menu
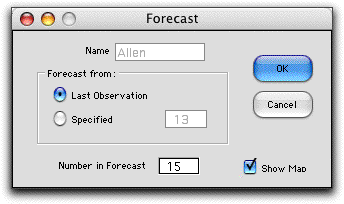
that performs the same operation. The dialog below is presented.
Normally the forecast is made from the last observation, 13
in this case. The Last Observation button makes this
selection. There may be occasions when it is instructive to
forecast at some earlier observation to see how well a forecast
tracks actual observations. Then the Specified button
is checked and the desired observation number is placed in the
field to the right of the button. We illustrate this case later.
The default value of the Number in Forecast is 15,
representing 90 hours into the future. To see a map of the past
observations and the forecast, click the Show Map checkbox.
On clicking OK, a forecast table is constructed
on the worksheet to the right of the data. The example is shown
below. The first entry is the known position at observation
13. The other positions are based on forecasting formulas. The
green colored cells indicate that the program computes
these values. The yellow colored cells hold Excel
formulas.
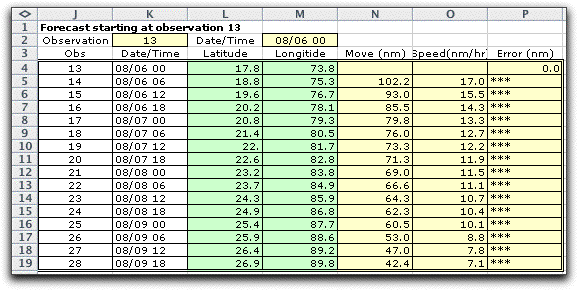
Columns are provided for the Move distance
and speed for the forecasted values. The Error column
has meaning only when the forecast observation is less than
the current observation. |
| |
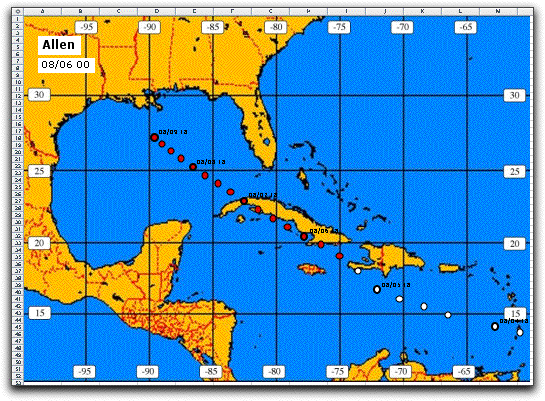
A map of the observations
is automatically created on a worksheet called Allen_Map.
The example map is shown below.
A less reduced portion of the map is shown below to illustrate
some detail.
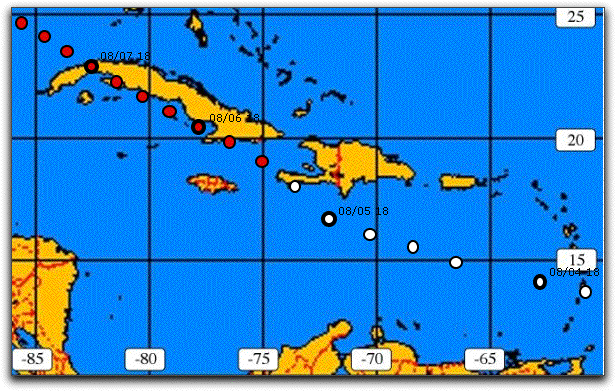
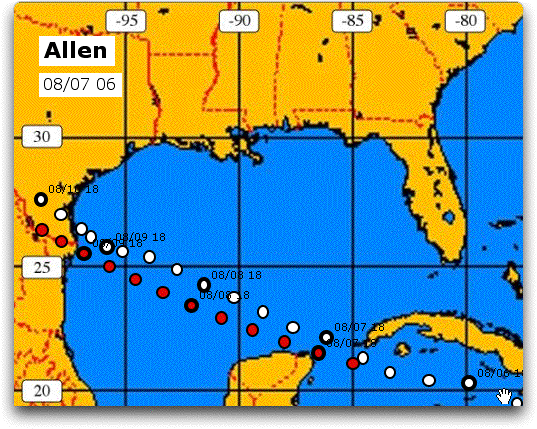
The white circles on the map show actual data and the red circles
show forecasted positions. Every fourth circle has a heavier
outline to indicate the passage of one day. Dates and times
are shown adjacent to these circles. |
| |
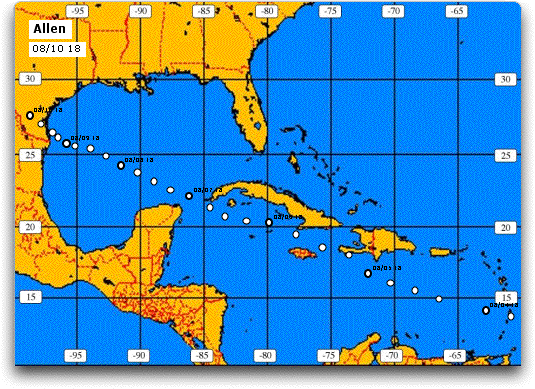
After the entire data
set has been entered, the final path of hurricane Allen
is shown below.
|
| |
The workbook contains
a single map (1000 points in width) is on worksheet Map.
Additional maps may be created by the user. Data describing a
map is stored in worksheet cells behind the map graphic. It is
important that the workbook include the worksheet with the map
used in the forecast. |
| |
Hurricane Allen required
32 observations when the storm was classified as a hurricane.
After all 32 entries we choose to forecast from observation
18 by using the forecast button and filling in the dialog as
below.
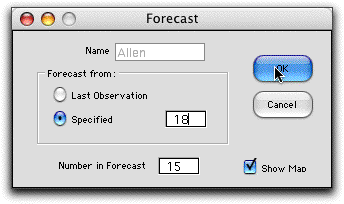
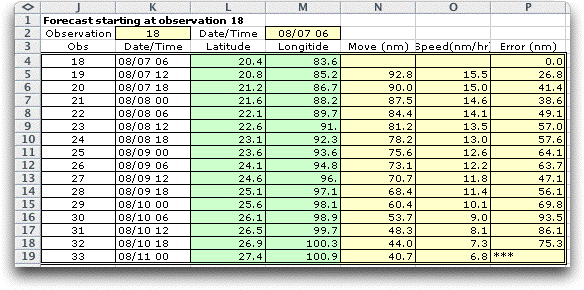
Since the forecast observation starts from 18,
the results can be compared with the actual positions for observations
19 through 32. The resulting errors are shown in column P below.
This Error column is used in the error analysis to
be described later.
For this option both the forecasted and actual
positions are shown on the map. The darkened circles, every
fourth observation, help compare the actual to the forecasted
path.
|
Additional Storms |
| |
A workbook can hold
several storms. A reasonable choice is to include all storms
that occur in a year in a single workbook.
The Hurricane workbook can be duplicated to hold additional
storms or storms from different years. Simply select the Hurrican.xls
file, duplicate it and rename the copy. The worksheets
holding old storms can be manually deleted with Delete Sheets
command on the Edit menu or by using the Old
command from the Hurricane menu.
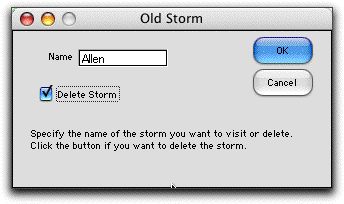
Entering the name of the storm and clicking the Delete
Storm checkbox will cause the data sheet and the map worksheet
for the storm to be deleted. If the checkbox is not checked,
the program will make the hurricane data page active.
It is important that the map worksheets not be deleted from
duplicated workbooks. The macros holding the programs are passed
to a duplicated workbook. |
Error Analysis |
| |
Clicking the Error
Analysis button after all the observations have been entered
creates an analysis of the errors made for all forecasts. The
result is shown below. The program goes through all possible forecast
observations (6 through 31) and computes the position errors of
the forecasts compared to the actual observations. The errors
are transferred to a new worksheet called Allen_Error.
The forecast errors for observation 6 are place in column F. There
is an error for each of the time intervals 6 through 90 hours.
The errors for each of the other observations are placed to the
right. Some columns are hidden in the figure. The forecasts near
the last observation (32) have errors for only a few intervals. |
|
|
| |
Summary error statistics
are computed in columns B through E. The mean error together
with one standard deviation above and below the mean is plotted
in the graph placed below the table.
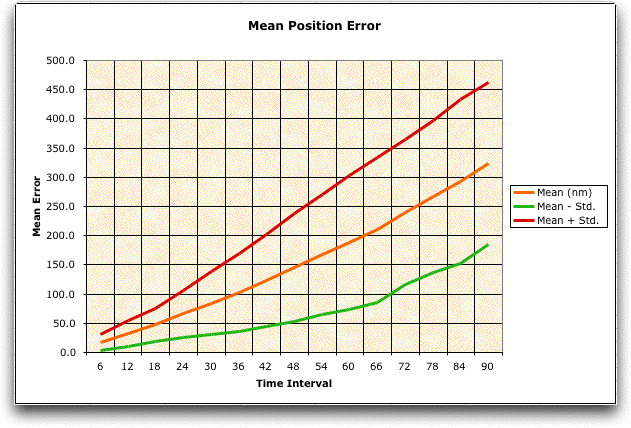
As expected, the mean error increases as the forecast interval
increases. The standard deviation also increases with interval.
The error for 72 hours (or three days) is particularly interesting
since that is a measure used by NHC for comparing forecasting
methods. |


