|
|
 |
|
Decision
Analysis
|
|
|
 |
Decision
Analysis |
 |
-
Example |
|
|
Computer Repair
A good customer has just given a microcomputer
repairwoman a failed machine. She would like to fix it with
the least expenditure of money. One of four parts is probably
failed. They are A, B, C, and D, with the cost of replacement
$100, $200, $30, and $80, respectively. We use the letters A
through D to represent the events that the failure is caused
by each of the four parts. Let E be the event that something
other than the four parts is causing the computer failure.
Three tests, X, Y, and Z, are available to help locate the failed
part. To perform the tests requires expenditures of $50, $70,
and $80, respectively. If E is discovered or the repairwoman
decides to abandon testing, the motherboard can be replaced
at a cost of $500.
The goal of the analysis is to determine an optimum strategy
maintenance that minimizes the expected cost of repair. The
strategy will specify the tests to be performed and the actions
that should be taken based on the outcomes of the tests.
|
| |
Decision Node
|
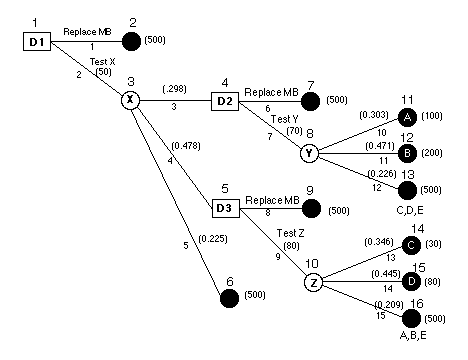
In the following, we construct the decision
tree that describes the details of the decision process.
The decision tree is the model for decision analysis. We build
the tree in steps, starting from the repairwoman's first decision.
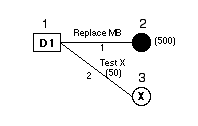
When the repairwoman first gets the machine
she can repair the machine by replacing the motherboard at a
cost of $500 or use test X to get a better idea what's wrong.
This represents the first decision in the process, whether to
perform the test. In the figure at the left, we begin to construct
the decision tree. The decision tree is a graphical description
of a sequential process and constitutes the major part of model
of the decision process. The first decision is indicated by
the rectangular node labeled 1. The symbol D1 interior to the
node identifies the decision. Two arcs leave the node indicating
the two possible decisions available at this point. The first
decision has two results: either replace the motherboard or
perform the X test. The labels on the arcs 1 and 2 correspond
to these two possibilities. The cost associated with the test
(50) is shown adjacent to the arc entering node 3.
For this and the following decision nodes, we allow only the
decisions specified in the text. For example, at D1 only two
decisions are available, either replace the motherboard
or do test X. Other conceivable actions such as replacing component
A or the two components A and B are not allowed at D1. If they
were, a much more complicated model would result.
|
| |
Terminal Node |
On the figure the decision to replace the motherboard leads to
a terminal node, shown as a black circle, labeled node 2. At terminal
nodes the process stops, and the cost associated with the terminal
state can be evaluated. The number adjacent to the node (500)
is the cost associated with reaching this node, that is, the cost
of replacing the motherboard. |
| |
Chance Node
|
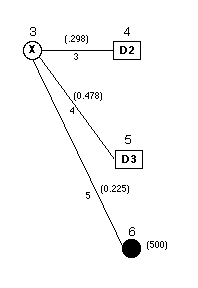
The decision to perform test X leads to node 3. This is a chance
node because the result of the test is uncertain. This kind
of node is shown as a white circle. Test X can come up with
three indications :failure probably due to A or B (arc 3), failure
probably due to C or D (arc 4), or an indication to replace
the motherboard (arc 5).
The figure shows the three possible events associated with
the experiment as arcs leaving the chance node. The numbers
on the arcs leaving the node are the probabilities of the three
test results. The events are mutually exclusive and constitute
the entire range of possibilities, so their probabilities sum
to 1. We describe how the probabilities are determined in a
later section. The arcs terminate at nodes that either represent
additional decisions or terminal events.
Note that this test does not accurately determine the cause
of failure. For example if the test indicates that the failure
is probably due to A or B, it could still be due to C, D or
E. Only the probabilities are affected.
|
| |
A Second Round of Decisions
|
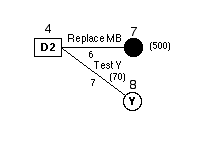
If Test X shows the first outcome, the repairwoman can either
use test Y or replace the motherboard. If the test shows the second
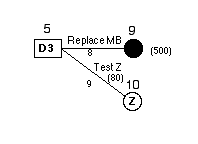
outcome, she can use test Z or replace the motherboard. If the
test shows the third outcome, she must replace the motherboard.
The figures show the detail associated with a second round
of decisions. With the first outcome for test X, the repairwoman
can either continue the fault isolation process with test Y
or immediately replace the motherboard. This is shown as decision
D2. The cost of test Y is $70. Note that only these two actions
are allowed. She cannot at this point replace the individual
components.
If test X results in the second outcome, she can continue
the isolation with test Z or replace the motherboard. This is
decision D3. The cost of test Z is $80. In both cases, the motherboard
replacement costs $500.
|
| |
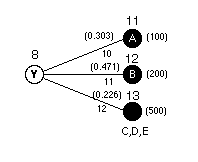
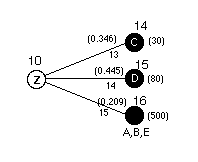
Outcomes for Tests Y and Z
|
We assume for the example that test Y can accurately identify
the cause of failure if it is due to component A or B. If either
of these indications is observed, the faulty component is repaired.
Every other cause (C, D, or E) is grouped into a third category.
If the test does not indicate A or B, the motherboard is replaced.
Similarly, test Z accurately identifies the fault if it is
due to C or D. If the test does not indicate C or D, the fault
must be in A, B or E. Rather than continue testing, the motherboard
is replaced. The test results together with the appropriate
probabilities and costs are shown in the figures.
|
| |
The Complete Tree |
The complete tree is shown in the figure below. The tree is the
model of the decision process. It consists of numbered nodes and
arcs. For a tree structure, the number of nodes is always one
more than the number of arcs. |
|