Return to Index
Operations Research Models and Methods
 
Computation Section
Random Variables
 - Simulating a Random Variable

Example: A Production Process

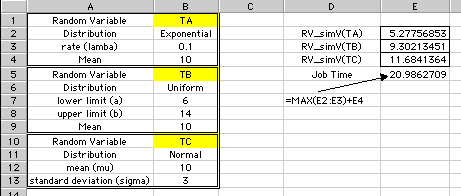
A particular job consists of three tasks. Task A and B are to be done simultaneously. Task C can begin only when both tasks A and B are complete. The times required for the tasks are TA, TB, and TC respectively, and all times are random variables. TA has an exponential distribution with a mean of 10 hours, TB has a uniform distribution that ranges between 6 and 14 hours, and TC has a Normal distribution with a mean of 10 hours and a standard deviation of 3 hours. We can see that the time to complete the project, Y, is a random variable that depends on the task times as

Y = Max{ TA, TB } +TC .

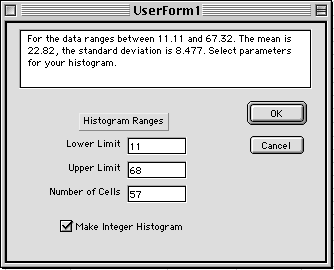
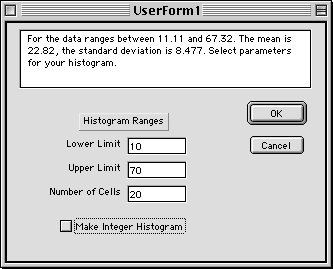
We have promised to complete the job in 20 hours. What is the probability that we will be successful?

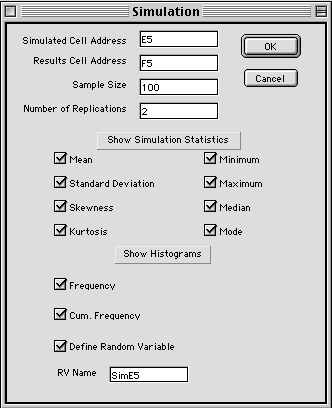
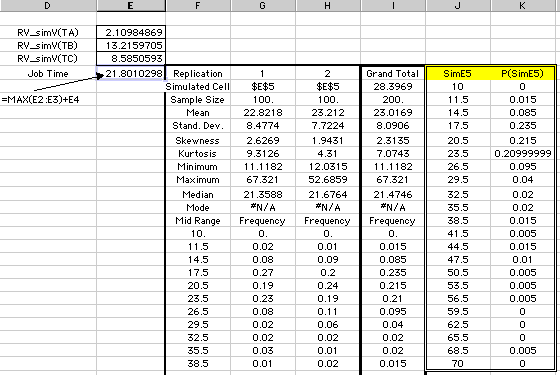
We set up the simulation on the worksheet shown below. The three random variables are created with the Add RV command. The simulated random variables are placed in column E. The total job time is computed with the formula in cell E5. This is the cell we will simulate. Column D shows the formulas used in column E. Note that we use the RV_simV function. A new value of the random variable is simulated with each recalculation of the worksheet.

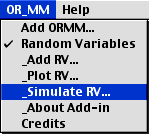
To run the simulation place the cursor on cell E5 and choose the Simulate RV command from the OR_MM menu.


 With this command you can simulate a cell whose value depends on one or more simulated random variables. On selecting the command the dialog box shown below appears. The Simulate Cell is the reference to the cell whose value is simulated. The Results Cell determines the location of the simulation results on the worksheet. The Sample Size is the number of independent simulations for each replication. The Replications is the number of times the simulation is run for the given sample size. The number of simulations is not limited by program, but choosing a number too large may cause the program to crash due to memory limitations.

The collection of checkboxes determine the output provided by the simulation. The simulation statistics are collected and reported for each replication together with the results for the combined replicatons. The boxes near the bottom describe the histograms to be collected. With the Define Random Variable button checked the program will construct a frequency histogram and define it as a User Defined discrete random variable. This allows the simulation output to generate a new random variable that can be used in subsequent analysis.

The worksheet is recomputed for each observation. The results are collected in arrays and stored in the memory. When the first replication is run, the data collection is interrupted for the presentation of the dialog below. This shows the results of the first replication and allows the user to select parameters for the histogram presentations.

We have adjusted the histogram parameters as in the dialog below. Pressing OK releases the program to complete the simulation.


The final results are shown below. The frequency histogram is truncated and the cumulative histogram is not shown. The user defined random variable SimE5, can be used just like any other random variable.


The original question was to find the probability that the job could be finished in fewer than 20 hours. One way to compute this result is to add the appropriate entries from the frequency histogram. Since we have defined the random variable SimE5, the results can be found using a probability statement about the random variable. The statement below shows that the probability is 0.335.


Return to Top

tree roots

Operations Research Models and Methods
Internet
by Paul A. Jensen
Copyright 2004 - All rights reserved