Return to Index
Operations Research Models and Methods
 
Computation Section
Production Model
  

This model describes a serial production system with a specified number of stations. The dialog has a field for Number of Stations. The checkbox adds a feature to the model that controls the flow of raw material into the system. This is illustrated later. The Raw Material Supply field is only relevant if this box is checked..

The worksheet illustrates a three station example. Station 1 accepts raw material, performs its operation and then passes the material to station 2. Station 2 performs a second operation and then passes the material to station 3. After the operation at station 3 the material leaves the system. The goal is to produce as much as possible.

The situation is complicated because in every period, each station has a capacity governed by a random variable. Here we have chosen to model the capacity in a station with a discrete-uniform random variable that ranges from 1 to 6. The production in any station cannot exceed the capacity during the period or the amount of material available from the previous station, thus if sufficient material is not available from its predecessors a station will not work up to its capacity. Every station but the last has an inventory to hold any excess production. Material stored in this intermediate inventory is called work in process (WIP).

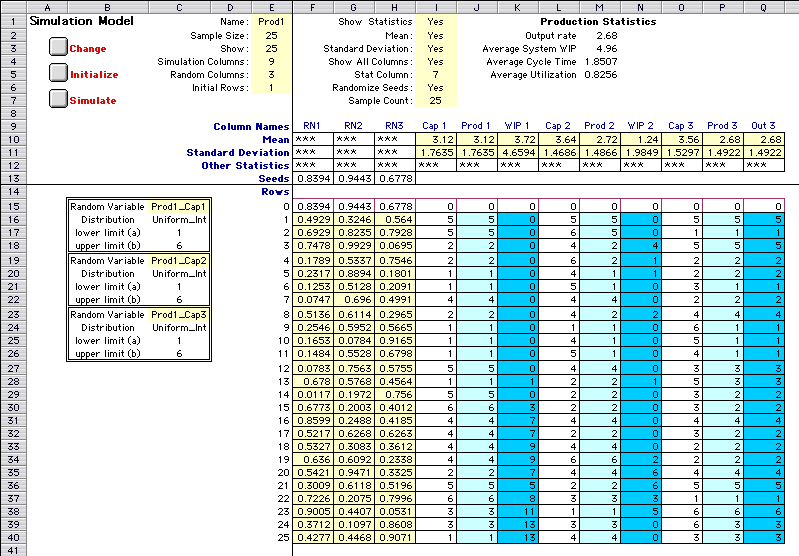
Looking at the example we see that the simulation is governed by three random variables. In the first period the randomly generated capacity of station 1 is five. Station 1 has no predecessors so all five are passed to station 2. Again station 2 has a capacity of five so all five units are passed to station 3. Luckily, station 3 also has a capacity of five, so in the first period five units leave the system.

Period 2 shows some variability. Station 1 again has a capacity of five, so station 2 receives all five units. Station 2 has a capacity of six in this period, but only the five units are available from station 1 to be processed. Station 3 has only a capacity of one, so only one unit is completed in period 2. The remaining four units remain in the WIP for station 2. This material can be used in period 3.

In period 3, station 1 has a capacity of only two, so two units pass to station 2. It has excess capacity of four, so the two units progress to 3. Station 3 has sufficient capacity so it can process the two units from station 2 and three of the units in WIP. Five units leave the system, and one remains in the WIP of station 2.

Reviewing the remaining periods, we see that the variability of production at the stations has two main affects. First the later stations do not process as many units as the earlier ones. As a consequence of this, inventory in the form of WIP appears in the system. The average capacity of every station is 3.5 units, however, because of the variability of production capacity, the system output rate can never exactly reach this level.

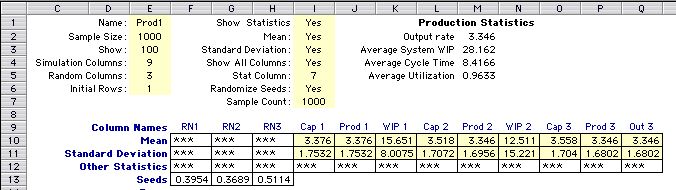
This result is shown more clearly in a run of 1000 periods. The output rate can never exceed the lowest average rate at any station, which happens to be station 1. Not surprisingly, system WIP is high. The cycle time, computed using Little's law, is

Cycle Time = WIP/Output Rate

The average time required for a unit to pass through the system is almost 8.5 periods. We should note that in this model, the minimum cycle time is 0, because material does not enter inventory if it passes through the system in a single period.

One suggestion for controlling a system such as this is to control the input flow of raw material. This is an option available for the model. The figure below shows a simulation run using the same random number seeds, but with raw material added to the system at a rate of three units per period. The results in this case indicate that system production is almost the same as the raw material flow rate. The system WIP and cycle time are much lower than without the raw material control.


There are a number of questions one might explore with this model.

  • What is the effect of reducing the variability of the production capacities? This could be done by reducing the range of the uniform distribution.
  • What is the effect of having more production stations? The model is easily constructed using the model dialog.
  • If one were to add more capacity, would be better at the beginning of the line or at the end? Capacity is added by increasing the upper range on the uniform distribution.
  • Can a similar simulation be constructed for a pull system of production, rather than the push system illustrated here?


Return to Top

tree roots

Operations Research Models and Methods
Internet
by Paul A. Jensen
Copyright 2004 - All rights reserved

Next Page