|
|
 |
Queuing
Add-in |
 |
-
Closed Queuing Networks |
|
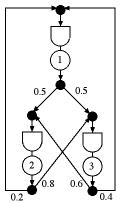
Figure 1 |
A closed queuing network consists of several stations as illustrated
in Fig. 1. For this structure the flow through each station
is passed to other stations. It is a closed network because
no flow enters from outside the network. The number of items
present in the system is N.
Each component of the network is a single server station with
the service activity represented by a circle and the queue represented
by the delay symbol (rectangular on one end and curved on the
other). Each station has a specified processing rate with a
mean processing time equal to the inverse of the rate. Processing
times are assumed to have exponential distributions. Items are
served with a first-come-first-served discipline. When an item
is completed at one station it passes to other stations according
to transition probabilities given by the numbers on the arcs
connecting the stations.
The analysis of the closed system is based on mean value
analysis. For a description of the analysis, see the pdf
supplement, Closed Queuing Systems.
|
| |
 |
To add a
model for a closed network of queues, place the cursor at the
worksheet cell where the model is to be located and select Closed
Network from the menu. The dialog box below allows entry
of the location, name and the number of stations in the system.
|
|
The worksheet for the example
is shown below. We will not try to explain on these pages
how the analysis is performed (see the supplement). Here
we describe the contents of the cells for the closed system.
The analysis assumes each station has a single server. The
only data that the user must enter are the station names
in row 1, station service rates in row 4, and the transition
probabilities in rows 16 to 18. The other cells on the display
are either yellow, indicating a formula or fixed value,
or green, indicating the results of an algorithmic computation.
The rows of the display are described by the titles in column
A. The initial display shows the results when N
is equal to 1. Columns A through D show station results
and columns E and F show system results.
|
 |
To obtain a solution for N
> 1, select Solve Closed from the menu. The
dialog below appears.
Enter the name of the network to be analyzed.
The Max. Population entry is the maximum value of
N. Mean value analysis is an iterative procedure
that computes results for N = 1, 2, etc. up to this
maximum value. The entry for Max. Throughput is provided
so that the analysis will stop when the specified throughput
is reached. The analysis stops when either the Max. Population
or the Max. Throughput is reached.
When the Show Iterations button is
checked, the results for each value of N are shown
below the network display. The results for N equal
to 10 is below.
|
|
The table below shows the
iteration results for the example with the value of N
ranging from 1 to 10. As the number in the system increases,
the throughput also increases, but at a slower and slower
rate. For the higher values, the congestion in the system
causes the system time to increase as more and more items
spend time in the queues. |
|
The analysis is valid only for the data present when the
Solve Closed procedure is called. If the data is
changed, the results are no longer valid and the procedure
must be called again.
|
|